本番環境で実際に機能するCI/CDパイプラインのセットアップ
実際のプロジェクトで実証済みのCI/CDパターン — GitHub Actionsワークフローから、金曜日に本番環境を壊さないデプロイ戦略まで。
私が本番プロジェクトで初めてセットアップしたCI/CDパイプラインは、npm testを実行し、その後SSH経由でVPSにデプロイする単一のGitHub Actionsワークフローでした。それは機能していましたが、ある時機能しなくなりました — デプロイの失敗により、金曜日の夜にサーバーが半更新状態になり、私は週末をファイルのロールバックに費やしました。その経験から、デプロイパイプラインは単に「テストを実行してからデプロイする」だけではないことを学びました。それは、git pushからユーザーが新しいコードを見るまでの間に存在する、チェック、ゲート、およびロールバックメカニズムのシステム全体なのです。
この記事では、私が複数の本番プロジェクトで洗練させてきたパイプラインアーキテクチャを、適応可能な具体的なGitHub Actionsの例とともに解説します。
パイプラインアーキテクチャ
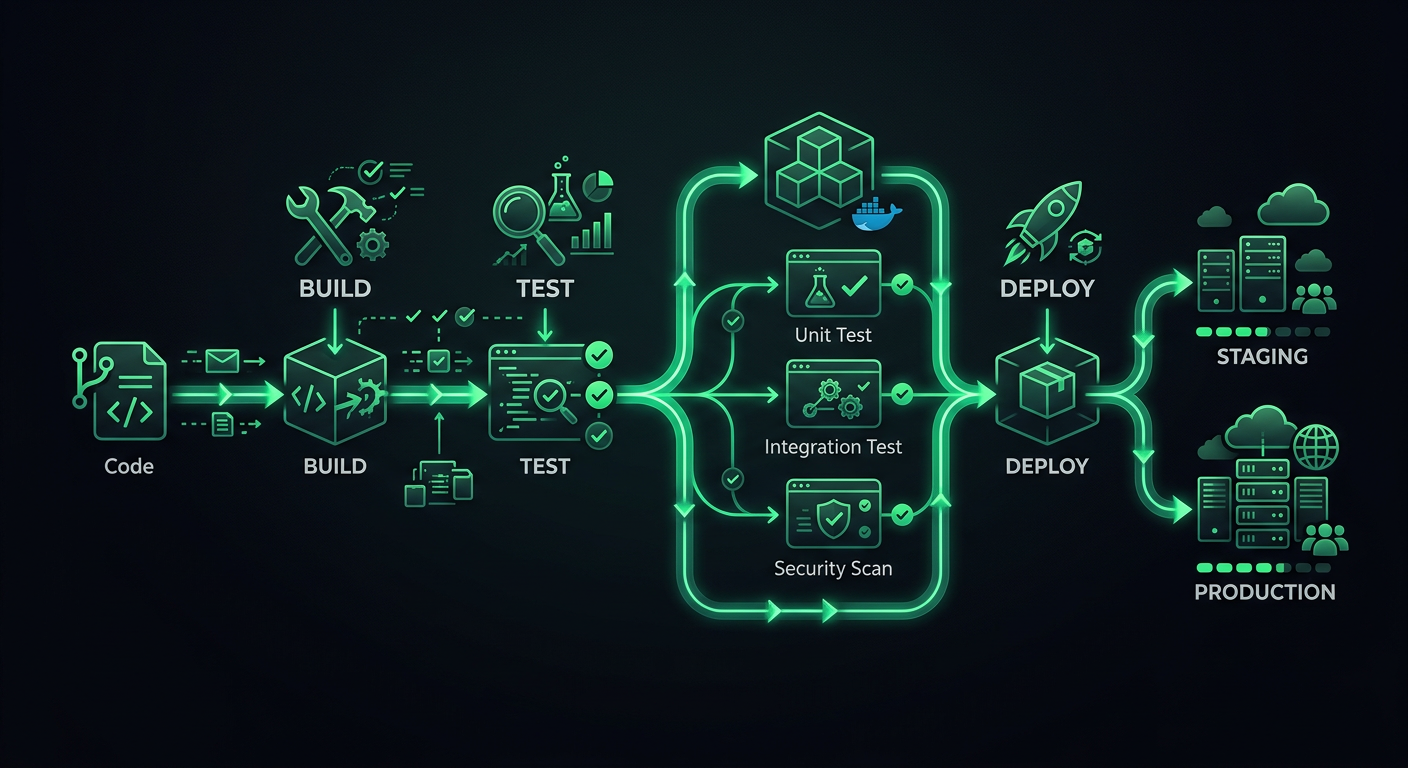
本番パイプラインには明確なステージがあり、各ステージには特定の目的があります。ステージをスキップすると、今は数分節約できますが、後で数時間かかることになります。
ステージ
Code Push
  │
  ├─→ Stage 1: Validation (lint, format, type-check)
  │
  ├─→ Stage 2: Testing (unit, integration)
  │
  ├─→ Stage 3: Build (compile, bundle, containerize)
  │
  ├─→ Stage 4: Deploy to Staging
  │
  ├─→ Stage 5: Smoke Tests / E2E on Staging
  │
  └─→ Stage 6: Deploy to Production
各ステージはゲートとして機能します。バリデーションが失敗すれば、テストは実行されません。テストが失敗すれば、ビルドは開始されません。これにより、計算時間を節約し、迅速なフィードバックを提供します — 開発者は、リンターの実行を忘れた場合、テストスイートが失敗するまで8分待つのではなく、30秒以内にそれを知ることができます。
トリガ戦略
すべてのプッシュに完全なパイプラインが必要なわけではありません。私が使用するトリガ設定は次のとおりです。
# .github/workflows/ci.yml
name: CI
on:
  push:
    branches: [main, develop]
  pull_request:
    branches: [main, develop]
    types: [opened, synchronize, reopened]
プルリクエストはステージ1〜3(バリデーション、テスト、ビルド)を実行します。developへのマージはステージングにデプロイします。mainへのマージは本番環境にデプロイします。これにより、PRのフィードバックを迅速に保ちつつ、デプロイが保護されたブランチからのみ行われるようにします。
ステージ1: バリデーション
バリデーションは、テストが実行される前にフォーマットの不整合や型エラーを検出します。これらのチェックは高速(30秒未満)で、最も一般的な問題を捕捉します。
jobs:
  validate:
    name: Validate
    runs-on: ubuntu-latest
    steps:
      - uses: actions/checkout@v4

      - name: Setup Node.js
        uses: actions/setup-node@v4
        with:
          node-version: 20
          cache: 'npm'

      - name: Install dependencies
        run: npm ci

      - name: Check formatting
        run: npx prettier --check "src/**/*.{ts,tsx,js,jsx,json,css}"

      - name: Lint
        run: npx eslint src/ --max-warnings 0

      - name: Type check
        run: npx tsc --noEmit
--max-warnings 0ルール
ESLintはエラー(プロセスを失敗させる)と警告(失敗させない)を区別します。--max-warnings 0がないと、チームは誰もが無視する何百もの警告を蓄積してしまいます。CIで警告をエラーとして扱うことで、チームはそれらを修正するか、明示的にルールを無効にするかのどちらかを強制されます。中間はありません。
CIチェックとしてのフォーマット、単なる提案ではない
CIでPrettierを実行する(--writeではなく--checkを使用)ことで、すべての開発者が適切なエディタ拡張機能を持っていることに頼ることなく、一貫したフォーマットを保証します。CIでフォーマットが失敗した場合、開発者はローカルでnpx prettier --write .を実行し、修正をコミットします。これは譲れない点です — フォーマットに関する議論は、ツールが決定を下すときに終わります。
ステージ2: テスト
テストはパイプラインのバックボーンです。より迅速なフィードバックのために、テストをタイプに基づいて並列ジョブに分割しています。
  unit-tests:
    name: Unit Tests
    runs-on: ubuntu-latest
    needs: validate
    steps:
      - uses: actions/checkout@v4

      - name: Setup Node.js
        uses: actions/setup-node@v4
        with:
          node-version: 20
          cache: 'npm'

      - name: Install dependencies
        run: npm ci

      - name: Run unit tests
        run: npx vitest run --coverage --reporter=verbose

      - name: Upload coverage report
        if: always()
        uses: actions/upload-artifact@v4
        with:
          name: coverage-report
          path: coverage/

  integration-tests:
    name: Integration Tests
    runs-on: ubuntu-latest
    needs: validate
    services:
      postgres:
        image: postgres:16
        env:
          POSTGRES_USER: test
          POSTGRES_PASSWORD: test
          POSTGRES_DB: testdb
        ports:
          - 5432:5432
        options: >-
          --health-cmd pg_isready
          --health-interval 10s
          --health-timeout 5s
          --health-retries 5
      redis:
        image: redis:7
        ports:
          - 6379:6379
    steps:
      - uses: actions/checkout@v4

      - name: Setup Node.js
        uses: actions/setup-node@v4
        with:
          node-version: 20
          cache: 'npm'

      - name: Install dependencies
        run: npm ci

      - name: Run database migrations
        run: npx prisma migrate deploy
        env:
          DATABASE_URL: postgresql://test:test@localhost:5432/testdb

      - name: Run integration tests
        run: npx vitest run --config vitest.integration.config.ts
        env:
          DATABASE_URL: postgresql://test:test@localhost:5432/testdb
          REDIS_URL: redis://localhost:6379
統合テストのためのサービスコンテナ
GitHub Actionsのサービスコンテナはあまり活用されていません。統合テストでデータベースをモックする(コードではなくモックをテストすることになる)代わりに、実際のPostgreSQLインスタンスを起動します。servicesブロックはライフサイクル管理を処理します — コンテナはテストの前に起動し、テストの後に停止します。
これにより、コンテナの起動に約15〜20秒がジョブに追加されますが、実際のデータベースに対してテストを行うことで得られる信頼性はそれだけの価値があります。
並列テスト実行
単体テストと統合テストは並列で実行されます(両方ともneeds: validateであり、needs: unit-testsではありません)。これにより、パイプラインの合計時間が短縮されます。単体テストに2分、統合テストに4分かかる場合、並列実行では6分ではなく4分待つことになります。
ステージ3: ビルド
ビルドステージは、プロジェクトがコンパイルされ、デプロイ可能なアーティファクトが生成されることを検証します。
  build:
    name: Build
    runs-on: ubuntu-latest
    needs: [unit-tests, integration-tests]
    steps:
      - uses: actions/checkout@v4

      - name: Setup Node.js
        uses: actions/setup-node@v4
        with:
          node-version: 20
          cache: 'npm'

      - name: Install dependencies
        run: npm ci

      - name: Build application
        run: npm run build
        env:
          NODE_ENV: production

      - name: Upload build artifacts
        uses: actions/upload-artifact@v4
        with:
          name: build-output
          path: dist/
          retention-days: 7
ビルドキャッシュ
Dockerベースのデプロイの場合、レイヤーキャッシュはビルドを劇的に高速化します。
  build-docker:
    name: Build Docker Image
    runs-on: ubuntu-latest
    needs: [unit-tests, integration-tests]
    steps:
      - uses: actions/checkout@v4

      - name: Set up Docker Buildx
        uses: docker/setup-buildx-action@v3

      - name: Login to Container Registry
        uses: docker/login-action@v3
        with:
          registry: ghcr.io
          username: ${{ github.actor }}
          password: ${{ secrets.GITHUB_TOKEN }}

      - name: Build and push
        uses: docker/build-push-action@v6
        with:
          context: .
          push: ${{ github.event_name != 'pull_request' }}
          tags: |
            ghcr.io/${{ github.repository }}:${{ github.sha }}
            ghcr.io/${{ github.repository }}:latest
          cache-from: type=gha
          cache-to: type=gha,mode=max
cache-from: type=ghaは、GitHub Actionsキャッシュを使用して、実行間でDockerレイヤーを保存します。一般的なNode.jsアプリケーションの場合、これにより、依存関係のみの変更に対するビルド時間が3〜4分から30〜60秒に短縮されます。
CIのためのDockerfileのベストプラクティス
Dockerfileの構造は、ビルドキャッシュの効率に直接影響します。レイヤーを、変更頻度が低いものから高いものの順に並べます。
FROM node:20-alpine AS base

# System dependencies (rarely changes)
RUN apk add --no-cache libc6-compat

# Package manifests (changes when dependencies change)
WORKDIR /app
COPY package.json package-lock.json ./

# Install dependencies (cached unless manifests change)
FROM base AS deps
RUN npm ci --production

FROM base AS build
RUN npm ci
COPY . .
RUN npm run build

# Production image
FROM node:20-alpine AS runner
WORKDIR /app
ENV NODE_ENV=production

COPY --from=deps /app/node_modules ./node_modules
COPY --from=build /app/dist ./dist
COPY --from=build /app/package.json ./

EXPOSE 3000
CMD ["node", "dist/server.js"]
マルチステージビルドにより、最終イメージは小さく保たれ(開発依存関係やソースコードなし)、レイヤーの順序付けにより、npm ciはpackage.jsonまたはpackage-lock.jsonが変更された場合にのみ実行されることが保証されます。
ステージ4: ステージングへのデプロイ
ステージングデプロイは、developブランチへのマージ時に自動的に行われます。ステージング環境は、可能な限り本番環境をミラーリングする必要があります — 同じインフラストラクチャ、同じ環境変数(異なる値)、同じスケーリング設定。
  deploy-staging:
    name: Deploy to Staging
    runs-on: ubuntu-latest
    needs: build
    if: github.ref == 'refs/heads/develop' && github.event_name == 'push'
    environment:
      name: staging
      url: https://staging.example.com
    steps:
      - uses: actions/checkout@v4

      - name: Download build artifacts
        uses: actions/download-artifact@v4
        with:
          name: build-output
          path: dist/

      - name: Deploy to Cloud Run (Staging)
        uses: google-github-actions/deploy-cloudrun@v2
        with:
          service: my-api-staging
          region: us-central1
          image: ghcr.io/${{ github.repository }}:${{ github.sha }}
          env_vars: |
            NODE_ENV=staging
            DATABASE_URL=${{ secrets.STAGING_DATABASE_URL }}
GitHub Environments
ワークフローのenvironmentキーは、GitHubの環境保護ルールを有効にします。手動承認を要求したり、デプロイできるブランチを制限したり、環境固有のシークレットを設定したりできます。ステージングの場合、通常は承認を必要としません(自動デプロイ)。本番環境の場合、少なくとも1人のレビューアを要求します。
ステージ5: スモークテスト
ステージングにデプロイした後、デプロイされたアプリケーションに対して基本的なテストセットを実行し、実際の環境で実際に機能することを確認します。
  smoke-tests:
    name: Smoke Tests
    runs-on: ubuntu-latest
    needs: deploy-staging
    steps:
      - uses: actions/checkout@v4

      - name: Setup Node.js
        uses: actions/setup-node@v4
        with:
          node-version: 20
          cache: 'npm'

      - name: Install dependencies
        run: npm ci

      - name: Wait for deployment
        run: |
          for i in {1..30}; do
            status=$(curl -s -o /dev/null -w "%{http_code}" https://staging.example.com/health)
            if [ "$status" = "200" ]; then
              echo "Service is healthy"
              exit 0
            fi
            echo "Waiting for service... (attempt $i)"
            sleep 10
          done
          echo "Service did not become healthy"
          exit 1

      - name: Run smoke tests
        run: npx playwright test --config=playwright.smoke.config.ts
        env:
          BASE_URL: https://staging.example.com
スモークテストは完全なE2Eテストではありません。それらは重要なパスを検証します:ホームページがロードできるか、ユーザーがログインできるか、主要なAPIエンドポイントがデータを返すか。2分未満で完了する5〜10のシナリオです。スモークテストが失敗した場合、ステージングデプロイはロールバックされ、本番デプロイは進行しません。
ステージ6: 本番デプロイ
本番デプロイは、デプロイ戦略が最も重要になる場所です。いくつかの異なるアプローチがあり、それぞれに異なるトレードオフがあります。
ローリングデプロイ
最もシンプルな戦略です。古いインスタンスがドレインされる間に、新しいインスタンスが起動されます。デプロイ中、いつでも一部のリクエストは古いバージョンにヒットし、一部は新しいバージョンにヒットします。これはほとんどのコンテナプラットフォームのデフォルトです。
長所: シンプル、追加のインフラコストなし。 短所: 2つのバージョンが同時にトラフィックを処理するため、データベーススキーマの変更やAPI契約の変更で問題が発生する可能性があります。
ブルー/グリーンデプロイ
2つの同一の環境(ブルーとグリーン)が存在します。一方がトラフィックを処理し、もう一方はアイドル状態です。アイドル状態の環境にデプロイし、それが機能することを確認してから、ルーターを切り替えます。何か問題が発生した場合は、元に戻します。
  deploy-production:
    name: Deploy to Production
    runs-on: ubuntu-latest
    needs: smoke-tests
    if: github.ref == 'refs/heads/main' && github.event_name == 'push'
    environment:
      name: production
      url: https://api.example.com
    steps:
      - name: Deploy new revision
        uses: google-github-actions/deploy-cloudrun@v2
        with:
          service: my-api-production
          region: us-central1
          image: ghcr.io/${{ github.repository }}:${{ github.sha }}
          flags: '--no-traffic'

      - name: Run production health check
        run: |
          REVISION_URL=$(gcloud run revisions describe my-api-production-${{ github.sha }} \
            --region us-central1 --format='value(status.url)')
          status=$(curl -s -o /dev/null -w "%{http_code}" "$REVISION_URL/health")
          if [ "$status" != "200" ]; then
            echo "Health check failed"
            exit 1
          fi

      - name: Migrate traffic
        run: |
          gcloud run services update-traffic my-api-production \
            --region us-central1 \
            --to-latest
--no-trafficフラグは、新しいリビジョンにトラフィックを送信せずにデプロイします。ヘルスチェックがパスした後、トラフィックは新しいリビジョンにシフトされます。ヘルスチェックが失敗した場合、ワークフローは停止し、古いリビジョンが引き続きサービスを提供します。
カナリアデプロイ
トラフィックのごく一部(5〜10%)を新しいバージョンにルーティングし、エラー率、レイテンシ、主要なビジネスメトリクスを監視します。定義された期間後にメトリクスが良好に見える場合、徐々にトラフィックを増やします。メトリクスが悪化した場合、ロールバックします。
      - name: Canary - route 10% of traffic
        run: |
          gcloud run services update-traffic my-api-production \
            --region us-central1 \
            --to-revisions=my-api-production-${{ github.sha }}=10

      - name: Monitor canary (5 minutes)
        run: |
          sleep 300
          # Check error rate for the canary revision
          ERROR_RATE=$(curl -s "$MONITORING_API/error-rate?revision=${{ github.sha }}")
          if (( $(echo "$ERROR_RATE > 1.0" | bc -l) )); then
            echo "Error rate too high: $ERROR_RATE%. Rolling back."
            gcloud run services update-traffic my-api-production \
              --region us-central1 \
              --to-latest
            exit 1
          fi

      - name: Promote canary to 100%
        run: |
          gcloud run services update-traffic my-api-production \
            --region us-central1 \
            --to-latest
カナリアデプロイを使用するタイミング: 10%のトラフィックでも統計的に意味のあるエラー率を生成するのに十分なトラフィックがある場合。1分あたり100リクエストを処理するサービスの場合、10%は1分あたり10リクエストとなり、数分以内に上昇したエラー率を検出するのに十分です。1分あたり10リクエストを処理するサービスの場合、カナリアデプロイは意味がありません。
ロールバックメカニズム
すべてのデプロイには、文書化されたロールバックパスが必要です。「古いバージョンを再デプロイする」はロールバック戦略ですが、遅いです。より良いオプションは次のとおりです。
トラフィックシフトによる即時ロールバック
--no-trafficでデプロイし、トラフィックをシフトする場合、ロールバックは単一のコマンドです。
# Roll back to the previous revision
gcloud run services update-traffic my-api-production \
  --region us-central1 \
  --to-revisions=PREVIOUS_REVISION=100
古いリビジョンがまだ実行されているため、これは数秒で有効になります。
自動ロールバック
エラー率が急増した場合に自動的にロールバックするデプロイ後の監視ステップを追加します。
      - name: Post-deploy monitor
        run: |
          for i in {1..10}; do
            sleep 60
            ERROR_RATE=$(curl -s "$MONITORING_API/error-rate?window=5m")
            if (( $(echo "$ERROR_RATE > 2.0" | bc -l) )); then
              echo "Error rate $ERROR_RATE% exceeds threshold. Rolling back."
              gcloud run services update-traffic my-api-production \
                --region us-central1 \
                --to-revisions=$PREVIOUS_REVISION=100
              exit 1
            fi
            echo "Minute $i: Error rate $ERROR_RATE% — OK"
          done
データベースマイグレーションのロールバック
これが最も難しい部分です。デプロイにデータベーススキーマの変更が含まれる場合、データベースをロールバックせずにアプリケーションをロールバックすると、不整合が生じます。解決策は拡張・縮小マイグレーションです。
- 拡張: 古い列を削除せずに新しい列/テーブルを追加します。新しい列はNULL許容にするか、デフォルト値を設定します。
- デプロイ: 新しいコードは古い列と新しい列の両方に書き込みます。新しい列から読み取り、古い列にフォールバックします。
- データ移行: 古いデータから新しい列をバックフィルします。
- 縮小: 検証後、新しい列のみを使用するコードをデプロイします。その後、古い列を削除します。
これにより、すべてのステップが独立して元に戻せるようになります。
シークレット管理
シークレットをハードコードしないでください。.envファイルをコミットしないでください。GitHub Actionsでのシークレットの扱い方は次のとおりです。
GitHub Secrets
ほとんどの場合、GitHubの組み込みシークレットで十分です。これらは暗号化され、ログに公開されることはなく、リポジトリまたは組織にスコープされます。
env:
  DATABASE_URL: ${{ secrets.DATABASE_URL }}
  API_KEY: ${{ secrets.API_KEY }}
環境スコープのシークレット
ステージングと本番環境で異なるシークレット。
deploy-staging:
  environment: staging
  # ${{ secrets.DATABASE_URL }} resolves to the staging value

deploy-production:
  environment: production
  # ${{ secrets.DATABASE_URL }} resolves to the production value
外部シークレットマネージャー
大規模なチームやより厳格なコンプライアンス要件の場合、AWS Secrets Manager、Google Secret Manager、またはHashiCorp Vaultを使用します。アプリケーションは、環境変数として受け取るのではなく、実行時にシークレットをフェッチします。
import { SecretManagerServiceClient } from '@google-cloud/secret-manager';

const client = new SecretManagerServiceClient();

async function getSecret(name: string): Promise<string> {
  const [version] = await client.accessSecretVersion({
    name: `projects/my-project/secrets/${name}/versions/latest`,
  });
  return version.payload?.data?.toString() || '';
}
デプロイの監視
デプロイはコードが稼働したときに完了するわけではありません。コードが機能していることを確認したときに完了します。
デプロイ通知
関連するコンテキストとともにデプロイイベントをSlackに送信します。
      - name: Notify Slack
        if: always()
        uses: slackapi/slack-github-action@v2
        with:
          webhook: ${{ secrets.SLACK_WEBHOOK }}
          webhook-type: incoming-webhook
          payload: |
            {
              "text": "${{ job.status == 'success' && 'Deployed' || 'Failed to deploy' }} `${{ github.sha }}` to production",
              "blocks": [
                {
                  "type": "section",
                  "text": {
                    "type": "mrkdwn",
                    "text": "*${{ job.status == 'success' && ':white_check_mark: Deployment Successful' || ':x: Deployment Failed' }}*\nCommit: `${{ github.sha }}`\nAuthor: ${{ github.actor }}\nMessage: ${{ github.event.head_commit.message }}"
                  }
                }
              ]
            }
デプロイ後のヘルスチェック
すべての本番デプロイ後、重要なエンドポイントが正しく応答することを確認します。
      - name: Verify production health
        run: |
          endpoints=("/" "/api/health" "/api/v1/status")
          for endpoint in "${endpoints[@]}"; do
            status=$(curl -s -o /dev/null -w "%{http_code}" "https://api.example.com$endpoint")
            if [ "$status" != "200" ]; then
              echo "FAILED: $endpoint returned $status"
              exit 1
            fi
            echo "OK: $endpoint returned $status"
          done
完全なパイプライン例
これらすべてをまとめると、Cloud RunにデプロイされたNode.jsアプリケーションの凝縮された、しかし完全なパイプラインは次のようになります。
name: CI/CD Pipeline
on:
  push:
    branches: [main, develop]
  pull_request:
    branches: [main, develop]

concurrency:
  group: ${{ github.workflow }}-${{ github.ref }}
  cancel-in-progress: ${{ github.event_name == 'pull_request' }}

jobs:
  validate:
    runs-on: ubuntu-latest
    steps:
      - uses: actions/checkout@v4
      - uses: actions/setup-node@v4
        with: { node-version: 20, cache: 'npm' }
      - run: npm ci
      - run: npx prettier --check "src/**/*.{ts,tsx}"
      - run: npx eslint src/ --max-warnings 0
      - run: npx tsc --noEmit

  test:
    needs: validate
    runs-on: ubuntu-latest
    services:
      postgres:
        image: postgres:16
        env: { POSTGRES_USER: test, POSTGRES_PASSWORD: test, POSTGRES_DB: testdb }
        ports: ['5432:5432']
        options: --health-cmd pg_isready --health-interval 10s --health-timeout 5s --health-retries 5
    steps:
      - uses: actions/checkout@v4
      - uses: actions/setup-node@v4
        with: { node-version: 20, cache: 'npm' }
      - run: npm ci
      - run: npx vitest run --coverage
        env:
          DATABASE_URL: postgresql://test:test@localhost:5432/testdb

  build-and-push:
    needs: test
    if: github.event_name == 'push'
    runs-on: ubuntu-latest
    steps:
      - uses: actions/checkout@v4
      - uses: docker/setup-buildx-action@v3
      - uses: docker/login-action@v3
        with:
          registry: ghcr.io
          username: ${{ github.actor }}
          password: ${{ secrets.GITHUB_TOKEN }}
      - uses: docker/build-push-action@v6
        with:
          context: .
          push: true
          tags: ghcr.io/${{ github.repository }}:${{ github.sha }}
          cache-from: type=gha
          cache-to: type=gha,mode=max

  deploy:
    needs: build-and-push
    runs-on: ubuntu-latest
    environment:
      name: ${{ github.ref == 'refs/heads/main' && 'production' || 'staging' }}
    steps:
      - uses: google-github-actions/auth@v2
        with:
          credentials_json: ${{ secrets.GCP_SA_KEY }}
      - uses: google-github-actions/deploy-cloudrun@v2
        with:
          service: my-api-${{ github.ref == 'refs/heads/main' && 'prod' || 'staging' }}
          region: us-central1
          image: ghcr.io/${{ github.repository }}:${{ github.sha }}
concurrencyブロックは注目に値します — プルリクエストで同じブランチの進行中の実行をキャンセルするため、CIがまだ実行中に修正をプッシュしても、2つのパイプラインがキューに登録されることはありません。
やり直すならこうする
もし今日、ゼロからパイプラインをセットアップするなら、バリデーションとテストステージのみから始めます — デプロイの自動化は行いません。コードベースが安定するまでの最初の数週間は、手動で(またはシンプルなデプロイスクリプトで)デプロイします。手動プロセスがボトルネックになったときに初めてデプロイの自動化を追加します。それ以前ではありません。時期尚早なパイプラインの最適化は、時期尚早なコードの最適化と同じくらい現実的であり、午前2時に壊れたデプロイパイプラインをデバッグすることは、手動で./deploy.shを実行するよりもはるかに悪いことです。